I made this thread in an effort to better inform and educate the community on how to pick the right turbo for their cars and their performance needs. This is simply a tool, it does not reflect Performance Autowerks's opinion on anything. These are simply calculation to help you figure out how your engine will perform with certain turbos.
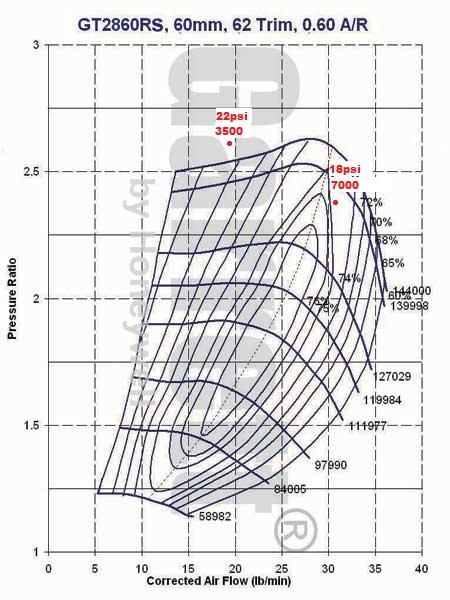
Well, here is the compressor map for our GT2860RS, with a couple of points plotted.
First, I am not going to get into detail on how these numbers are figured. If you would like to know yourself, I have good sources that I can get you, if you are interested.
Now, let me explain how to read this. On the left, there is the
Pressure Ratio, and on the bottom is the
Flow. All Garret maps that I have seen, read in lb/min, but some other manufacturer's maps read in cfm, or some other numbers I don't fully understand. The plots are found by numerous equations (which I conveniently made a spreadsheet for, so you can play with the figures yourself, if you would like). The lines in the middle are the range of efficiency. The lines that go more up and down are the % of efficiency, and the lines that go more horizontal are RPM's the turbo is spinning at. Just because a plot is outside those lines does not mean that its horrible, it just means that the heat the turbo is producing is not the most efficient for power production, and that you are approaching the redline of the turbo components, thus shortening turbo life. The dotted line on the left is the
Surge Threshold, any plots that are left of that, need to be avoided, otherwise surge will result.
So, I plotted just a couple of points... These points would keep the car in the range of the sensors. The first plot is at 3500rpm and 22psi, where this turbo will be at full spool. Though it is out of the range of efficiency, its not too far out to be considered bad (since they can't put all of the figures on the map, they leave these out).
And, the second plot is 18psi at a 7000 rpm redline. This is perfect for the upper end, if you are commanding 18psi. It is right in the range of efficiency.
Now, what do the end numbers result in, you ask? The bottom numbers can be closely related to brake horsepower (crank hp). It has been found that there are approximately 10.5bhp per lb/min of MAF flow. So, one could estimate the (CRANK) power produced at certain plots this way. These power numbers are simply an ESTIMATION. They may seem low, do not let it discourage you from a particular turbo, as tuning plays a very major role in how a turbo spools, and how the car reacts to the air flow.
My idea of how this turbo spools, and how it flows 'til redline is purely speculation. These numbers are NOT set in stone, and they DO NOT reflect much really, to be honest. This is simply a tool to pick out what turbo is best for your engine. Obviously, if you are looking for about 325whp, then this GT28 would be ideal. If you are looking for more, then you would need a bigger turbo.
I am working on an attachment of the spreadsheet I made. apparently we cannot upload Excel files as attachments, so I will have to put it in a Zip File, or something else. I also have emailed Precision Turbo to see if I can get a compressor map for the 5457 we use in the '50 trim' turbo kits. If I can get one, I will post it up here for you to use, otherwise the Garrett website has all of their maps.
I hope someone else has fun with this. It was really fun for me to make all of this, and to hopefully teach someone something I know.